Connectivity Troubleshooting
When deploying Kasm at scale in enterprise type settings, with advanced L7 firewalls, proxies, and other security devices in the path, there is no end to the possible combinations of configurations and devices at play. Therefore, an advanced guide is needed to assist engineers in finding potential problems within their environment that may be keeping Kasm from working properly.
Note
When troubleshooting this issue, always test by creating new sessions after making changes. Resuming a session may not have the changes applied.
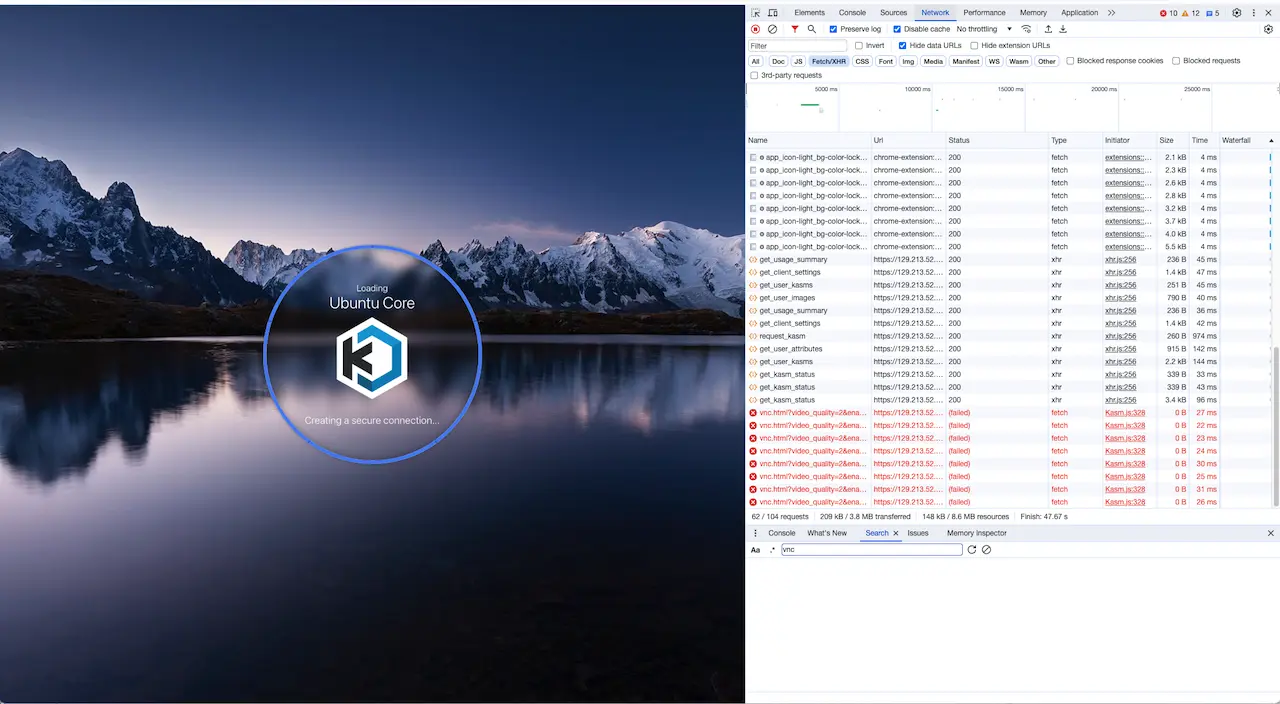
This section assumes that users are able to get to the Kasm Workspaces application and login. Users are able to create a session and Kasm does provision a container or VM session for the user. The user would typically see the following connecting screen which may loop, the screenshot below is shown with Chrome Developer Tools open.

Session hangs at requesting Kasm
Browser Extensions
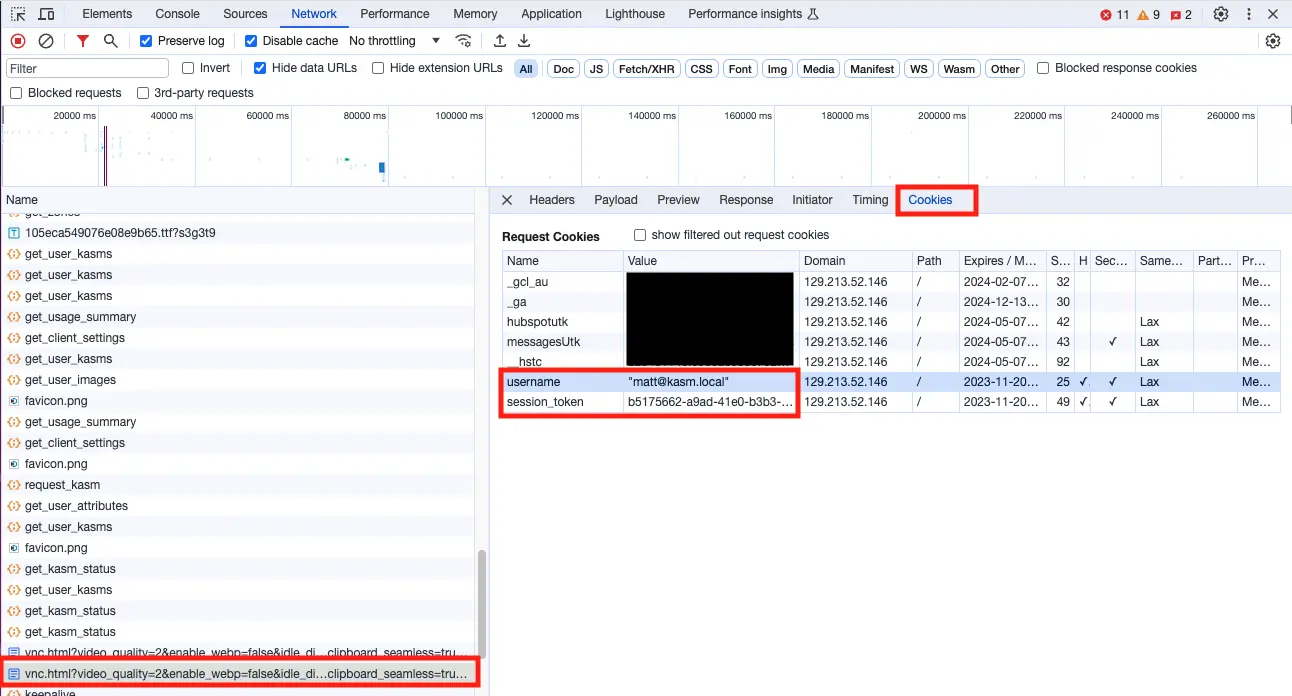
As a first step, open a new Incognito Window, ensure no other Incognito Windows are open before opening a new one. This will ensure that browser extensions are disabled. It will also ensure cookie collisions do not occur. Ensure to use the Incognito Window for all further testing as you progress through the following sections. If the problem goes away immediately when using an Incognito Window, try a normal window but disable all browser extensions. Enable them one at a time until the issue appears again. If you cannot load a session with all browser extensions disabled, but you can load a session in an Incognito Window, then it is likely a cookie issue. Follow the troubleshooting steps in the Validating Session Cookies, Cookie Conflict, and Cookie Transit sections.
Validate Session Port
Here is an expanded view of the above example with the Url field extended. In this below example, the port going to the KasmVNC session is on 8443 while the Kasm Web application seems to be on port 443. This is likely a misconfiguration. Many organizations will configure Kasm Workspaces to run on a high port number internally, but then proxy to the internet on port 443. This is very common in the DoD and Federal sector where DISA STIGs disallow the use of privileged low port numbers on internal servers.

Session hangs at requesting Kasm
What typically occurs is that Kasm Workspaces is installed internally on a high port number. When accessing Kasm directly on the
high port number, it works fine. When accessing Kasm externally through a proxy on port 443, Kasm sessions fail to load. The
setting that applies here is the Zone proxy port setting. This port
setting is relative to the client. So if Kasm has been configured to internally be running on 8443, but it is proxied by an F5,
for example, on port 443, the Zone setting Proxy Port should be set to port 443. After changing the setting, you will need to
destroy any existing sessions. Newly created sessions will pick up the new port change.
WebSockets
The actual stream of the desktop session goes through a websocket connection, and websocket connections are handled differently
and may be blocked or otherwise disrupted by security software installed on the client system or by security devices in the
path from the client to the Kasm WebApp servers. First, make sure that the client is sending the request for the websocket
connection in the first place. Open up DevTools in the browser, go to the Network tab, and then attempt to connect to a
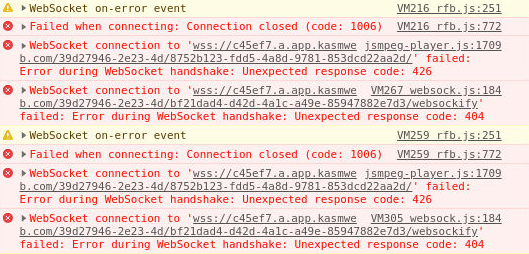
session. Click the WS filter, shown in the below screenshot, to get just the websocket connections and look for the websockify request.

DevTools WebSocket
Also check the console tab in DevTools and ensure you don’t see errors.

Session hangs at requesting Kasm
Next, determine if the websockify request is making it all the way to the target agent. The easiest way to quickly determine if the websocket connection is making it all the way down to the agent is to run the following command on the agent.
sudo docker logs -f kasm_proxy 2>&1 | grep '/websockify ' | grep -v -P '(internal_auth|kasm_connect)'
123.123.123.123 - - [15/Nov/2023:18:50:20 +0000] "GET /desktop/72248a05-922d-4518-b92f-7a9d1ea529eb/vnc/websockify HTTP/1.1" 101 3104787 "-" "Mozilla/5.0 (Macintosh; Intel Mac OS X 10_15_7) AppleWebKit/537.36 (KHTML, like Gecko) Chrome/119.0.0.0 Safari/537.36" "-"
In the above example, the request was received and the response code was 101, which is what should happen. If you see this request come in on the agent, then this means the websocket has traversed all the way through the stack to the agent. In this case proceed to the next section.
If you do not see any output from the above command on the Agent, then something in your stack, prior to Kasm is interfering with the websocket connection.
KasmVNC Troubleshooting
If you have verified all the above steps the next step is to troubleshoot KasmVNC. First, enable debug logging on the user container.
In the Kasm Admin UI, navigate to Workspaces -> Workspaces
Find the target Workspace in the list and click the Edit button.
Scroll down to the Docker Run Config Override field and paste in the following.
{ "environment": { "KASM_DEBUG": 1 } }Launch a new session
Now SSH to the agent that the session was provisioned on and run the following command to get a shell inside the container.
# Get a list of running containers and identify your session container, the name of the container contains your partial username and session ID.
sudo docker ps
CONTAINER ID   IMAGE                                                               COMMAND                  CREATED         STATUS                PORTS                                           NAMES
125348fe9990   kasmweb/core-ubuntu-jammy-private:feature_KASM-5078_multi-monitor   "/dockerstartup/kasm…"   3 minutes ago   Up 3 minutes          4901/tcp, 5901/tcp, 6901/tcp                    mattkasm.loc_4f8ada7f

# Get a shell inside of the container
sudo docker exec -it 125348fe9990 /bin/bash
default:~$

# Tail the KasmVNC logs
default:~$ tail -f .vnc/125348fe9990\:1.log
With the tail of the logs running, try to connect to the session. You will see a bunch of normal HTTP requests that are loading the static page resources such as vnc.html, javascript, stylesheets, etc. They will look like the following:
 2023-11-17 14:51:07,525 [DEBUG] websocket 141: BasicAuth matched
 2023-11-17 14:51:07,525 [INFO] websocket 141: /websockify request failed websocket checks, not a GET request, or missing Upgrade header
 2023-11-17 14:51:07,525 [DEBUG] websocket 141: Invalid WS request, maybe a HTTP one
 2023-11-17 14:51:07,525 [DEBUG] websocket 141: Requested file '/app/sounds/bell.oga'
 2023-11-17 14:51:07,525 [INFO] websocket 141: 172.18.0.9 71.62.47.171 kasm_user "GET /app/sounds/bell.oga HTTP/1.1" 200 8701
 2023-11-17 14:51:07,525 [DEBUG] websocket 141: No connection after handshake
 2023-11-17 14:51:07,525 [DEBUG] websocket 141: handler exit
The first field is the date and time. After the time is a comma, followed by a number, that number is a HTTP request ID. Group each request by ID, so that you have all logs for a specific request. In the above example, all the logs were produced for the request for /app/sounds/bell.oga. The above log of “/websockify request failed websocket checks, not a GET request, or missing Upgrade header” is misleading. This is not, in and of itself an issue. It merely means that the incoming request was not a websocket request. In the beginning, KasmVNC only had a websocket server and it did not handle other types of web requests. The message is only relevant if the requested file was /websockify. If you saw the message “/websockify request failed websocket checks, not a GET request, or missing Upgrade header” for the /websockify file, then this means that KasmVNC was unable to identify the request as a valid websocket connection.
Below is an example of what you should see for the websocket connection. Note the message “using protocol HyBi/IETF 6455 13” indicating that KasmVNC was able to correctly identify the exact Websocket specification being used by the browser.
 2023-11-17 14:51:07,526 [DEBUG] websocket 142: using SSL socket
 2023-11-17 14:51:07,526 [DEBUG] websocket 142: X-Forwarded-For ip '71.62.47.171'
 2023-11-17 14:51:07,529 [DEBUG] websocket 142: BasicAuth matched
 2023-11-17 14:51:07,529 [DEBUG] websocket 142: using protocol HyBi/IETF 6455 13
 2023-11-17 14:51:07,529 [DEBUG] websocket 142: connecting to VNC target
 2023-11-17 14:51:07,529 [DEBUG] XserverDesktop: new client, sock 32
In some cases KasmVNC could have a bug. In the recent past, KasmVNC would crash due to large cookies or if the websocket connection was not exactly to the spec. These issues have since been corrected, however, there is no end to the combination of devices and services out there that sit between users and Kasm. In some cases these security devices or services manipulate the HTTP requests in a way that brings them out of compliance with the specification. This can cause improper handling by KasmVNC. The following is an exmaple of what a crash would look like in the KasmVNC logs.
(EE)
(EE) Backtrace:
(EE) 0: /usr/bin/Xvnc (xorg_backtrace+0x4d) [0x5e48dd]
(EE) 1: /usr/bin/Xvnc (0x400000+0x1e8259) [0x5e8259]
(EE) 2: /lib/x86_64-linux-gnu/libpthread.so.0 (0x7f5a57ef6000+0x12980) [0x7f5a57f08980]
(EE) 3: /lib/x86_64-linux-gnu/libc.so.6 (epoll_wait+0x57) [0x7f5a552eca47]
(EE) 4: /usr/bin/Xvnc (ospoll_wait+0x37) [0x5e8d07]
(EE) 5: /usr/bin/Xvnc (WaitForSomething+0x1c3) [0x5e2813]
(EE) 6: /usr/bin/Xvnc (Dispatch+0xa7) [0x597007]
(EE) 7: /usr/bin/Xvnc (dix_main+0x36e) [0x59b1fe]
(EE) 8: /lib/x86_64-linux-gnu/libc.so.6 (__libc_start_main+0xe7) [0x7f5a551ecbf7]
(EE) 9: /usr/bin/Xvnc (_start+0x2a) [0x46048a]
(EE)
(EE) Received signal 11 sent by process 17182, uid 0
(EE)
Fatal server error:
(EE) Caught signal 11 (Segmentation fault). Server aborting
(EE)
KasmVNC will be restarted automatically by the container’s entrypoint script, so you may see this repeat. Copy the backtrace output and provide it to Kasm support, along with the output of the following command.
sudo docker exec -it 125348fe9990 Xvnc -version

Xvnc KasmVNC 1.2.0.e4a5004f4b89b9da78c9b5f5aee59c08c662ccec - built Oct 31 2023 11:22:56
Copyright (C) 1999-2018 KasmVNC Team and many others (see README.me)
See http://kasmweb.com for information on KasmVNC.
Underlying X server release 12008000, The X.Org Foundation
With the above information we should be able to symbolize the backtrace and potentially find out what the issue is.
Server Configuration Issues
The following sub sections cover configuration issues on individual servers. These issues would be at the host OS level, so not with Kasm itself, but with the configuration of the host operating system or dependencies therein.
Confirm Local Connectivity
Sometimes in troubleshooting, if individual Kasm service containers are started, stopped, or restarted, the Kasm proxy container may lose the local hostname resolution of the other containers. First, lets stop and start the Kasm services to ensure hostname resolution is refreshed and that all containers were started in the proper order.
/opt/kasm/bin/stop
/opt/kasm/bin/start
Next lets confirm that all services are up, running, and healthy. The following output shows that all services are up, running, and healthy. This is from a single server deployment.
sudo docker ps -a
CONTAINER ID   IMAGE                             COMMAND                  CREATED      STATUS                PORTS                                           NAMES
401963ee87a0   kasmweb/proxy:1.17.0              "/docker-entrypoint.…"   6 days ago   Up 6 days             80/tcp, 0.0.0.0:443->443/tcp, :::443->443/tcp   kasm_proxy
0eb604899140   kasmweb/agent:1.17.0              "/bin/sh -c '/usr/bi…"   6 days ago   Up 6 days (healthy)   4444/tcp                                        kasm_agent
140660c3c201   kasmweb/manager:1.17.0            "/bin/sh -c '/usr/bi…"   6 days ago   Up 6 days (healthy)   8181/tcp                                        kasm_manager
1ed22b860c6b   kasmweb/kasm-guac:1.17.0          "/dockerentrypoint.sh"   6 days ago   Up 6 days (healthy)                                                   kasm_guac
109bf1f9fa3d   kasmweb/rdp-https-gateway:1.17.0  "/opt/rdpgw/rdpgw"       6 days ago   Up 6 days (healthy)   0.0.0.0:9443->9443/tcp, :::9443->9443/tcp       kasm_rdp_https_gateway
dfffa127e9c5   kasmweb/rdp-gateway:1.17.0        "/start.sh"              6 days ago   Up 6 days (healthy)   0.0.0.0:3389->3389/tcp, :::3389->3389/tcp       kasm_rdp_gateway
5759e5692a85   kasmweb/api:1.17.0                "/bin/sh -c 'python3…"   6 days ago   Up 6 days             8080/tcp                                        kasm_api
670da792ed27   postgres:14-alpine                "docker-entrypoint.s…"   7 days ago   Up 7 days (healthy)   5432/tcp                                        kasm_db
For a WebApp server on a multi-server deployment, the output should look like the following.
sudo docker ps -a
CONTAINER ID   IMAGE                       COMMAND                  CREATED      STATUS                PORTS                                           NAMES
401963ee87a0   kasmweb/proxy:1.17.0        "/docker-entrypoint.…"   6 days ago   Up 6 days             80/tcp, 0.0.0.0:443->443/tcp, :::443->443/tcp   kasm_proxy
140660c3c201   kasmweb/manager:1.17.0      "/bin/sh -c '/usr/bi…"   6 days ago   Up 6 days (healthy)   8181/tcp                                        kasm_manager
5759e5692a85   kasmweb/api:1.17.0          "/bin/sh -c 'python3…"   6 days ago   Up 6 days             8080/tcp                                        kasm_api
For an Agent server on a multi-server deployment, the output should look like the following.
sudo docker ps -a
CONTAINER ID   IMAGE                       COMMAND                  CREATED      STATUS                PORTS                                           NAMES
401963ee87a0   kasmweb/proxy:1.17.0        "/docker-entrypoint.…"   6 days ago   Up 6 days             80/tcp, 0.0.0.0:443->443/tcp, :::443->443/tcp   kasm_proxy
0eb604899140   kasmweb/agent:1.17.0        "/bin/sh -c '/usr/bi…"   6 days ago   Up 6 days (healthy)   4444/tcp                                        kasm_agent
Make note of the port number in the output of the kasm_proxy container. From the above examples you can see
0.0.0.0:443->443/tcp, which indicates that the host’s port 443 is mapped to the container’s port 443. This indicates
that kasm was installed on port 443, ensure this matches your expectation.
Next, ensure that there is a program listening on the target port.
ss -ltn
State               Recv-Q              Send-Q                            Local Address:Port                              Peer Address:Port              Process
LISTEN              0                   4096                                    0.0.0.0:111                                    0.0.0.0:*
LISTEN              0                   4096                              127.0.0.53%lo:53                                     0.0.0.0:*
LISTEN              0                   128                                     0.0.0.0:22                                     0.0.0.0:*
LISTEN              0                   4096                                    0.0.0.0:443                                    0.0.0.0:*
LISTEN              0                   511                                   127.0.0.1:35521                                  0.0.0.0:*
LISTEN              0                   511                                     0.0.0.0:9001                                   0.0.0.0:*
LISTEN              0                   4096                                       [::]:111                                       [::]:*
LISTEN              0                   128                                        [::]:22                                        [::]:*
LISTEN              0                   4096                                       [::]:443                                       [::]:*
The above output shows that my server is listening on port 443 on both ipv4 and ipv6.
Next, get the local IP address of the user facing network interface.
ubuntu@roles-matt:~$ ip add
1: lo: <LOOPBACK,UP,LOWER_UP> mtu 65536 qdisc noqueue state UNKNOWN group default qlen 1000
    link/loopback 00:00:00:00:00:00 brd 00:00:00:00:00:00
    inet 127.0.0.1/8 scope host lo
       valid_lft forever preferred_lft forever
    inet6 ::1/128 scope host
       valid_lft forever preferred_lft forever
2: ens3: <BROADCAST,MULTICAST,UP,LOWER_UP> mtu 9000 qdisc pfifo_fast state UP group default qlen 1000
    link/ether 02:00:17:0f:8c:19 brd ff:ff:ff:ff:ff:ff
    altname enp0s3
    inet 10.0.0.106/24 metric 100 brd 10.0.0.255 scope global ens3
       valid_lft forever preferred_lft forever
    inet6 fe80::17ff:fe0f:8c19/64 scope link
       valid_lft forever preferred_lft forever
Ignore loopback interfaces, docker0, bridge interfaces, and any other interfaces without an IP address. In the example above we can see the IP address is 10.0.0.106. Curl the IP address using HTTPS on the expected port number.
# Correct Output
curl -k https://10.0.0.106:443/api/__healthcheck
{"ok": true}

# Failure
curl -k https://10.0.0.106:443/api/__healthcheck
curl: (7) Failed to connect to 10.0.0.106 port 443 after 0 ms: Connection refused
If that command either hung or immediately returned a Connection refused message as shown above in the failure case, then
your local system likely has a firewall running, see the next section.
Host Based Firewalls
Host based firewalls such as McAfee HBSS and even the Linux default UFW can interfere with communications. Docker manages iptables rules and other firewalls and security products either apply additional rules or actually use iptables as well. This can result in corrupt iptables rules.
If you have UFW installed, run the following to allow https on port 443. See the UFW documentation on how to make this rule permanent, add alternative ports, or for additional usage instructions.
sudo ufw status

sudo ufw allow https
The following commands will completely clear IP tables rules and any NAT rules.
This may break your system, ensure you know what you are doing
# shut down kasm
/opt/kasm/bin/stop

# Accept all traffic first to avoid ssh lockdown  via iptables firewall rules #
iptables -P INPUT ACCEPT
iptables -P FORWARD ACCEPT
iptables -P OUTPUT ACCEPT

# Flush All Iptables Chains/Firewall rules #
iptables -F

# Delete all Iptables Chains #
iptables -X

# Flush all counters too #
iptables -Z
# Flush and delete all nat and  mangle #
iptables -t nat -F
iptables -t nat -X
iptables -t mangle -F
iptables -t mangle -X
iptables -t raw -F
iptables -t raw -X

# Restarting docker will regenerate the iptables rules that docker needs
sudo systemctl restart docker

# Bring Kasm back up
/opt/kasm/bin/start
If the above fixes your issues, it may only be temporary. You may have security or configuration management software installed on your server that eventually re-apply the offending rules. Please consult the documentation of your offending software for remediation.
